I finally had time to watch some of the WWDC talks related to Xcode 10 today, and I wanted to share some very interesting and useful new tips to improve the build times of Swift and Objective-C projects in Xcode 10.
Most of the content in this post is taken from WWDC 2018 Session 408 - Building Faster in Xcode.
Parallelizing your build process
Previously to Xcode 10, all the targets were built serially, which means that only one target can be built at any given time. Xcode 10 is now much faster in building since it distributes tasks across multiple cores to build targets in parallel whenever possible. Let’s take the example shown in the session to see how the timeline would look in order to build 5 targets in Xcode 9.
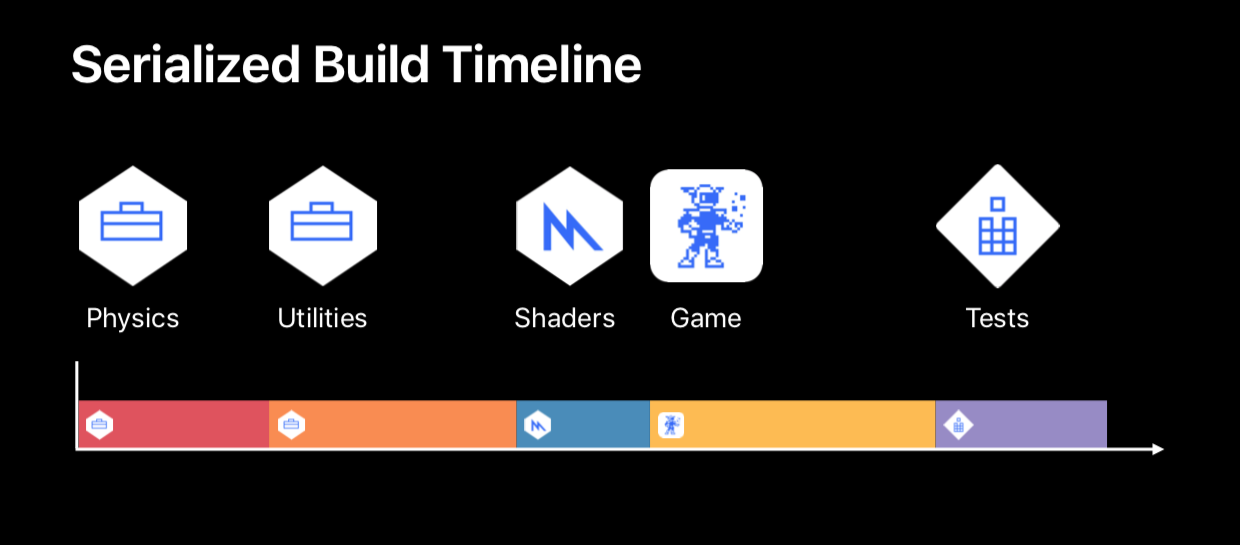 In Xcode 9 every target is built after the other.
All the targets are built one after the other, starting from the ones that are dependencies of other targets. One real example of where you may have noticed this behavior is when using CocoaPods. If you have 10 dependencies in your Podfile, Xcode needs to build all the Pods before building your target. This is why using Carthage usually decreases your build times, since the dependencies are compiled once and only linked at runtime with your app target.
Xcode 10 tries to make better utilization of the available hardware by distributing on multiple cores the targets to build. Thus, the timeline could look like something like this.
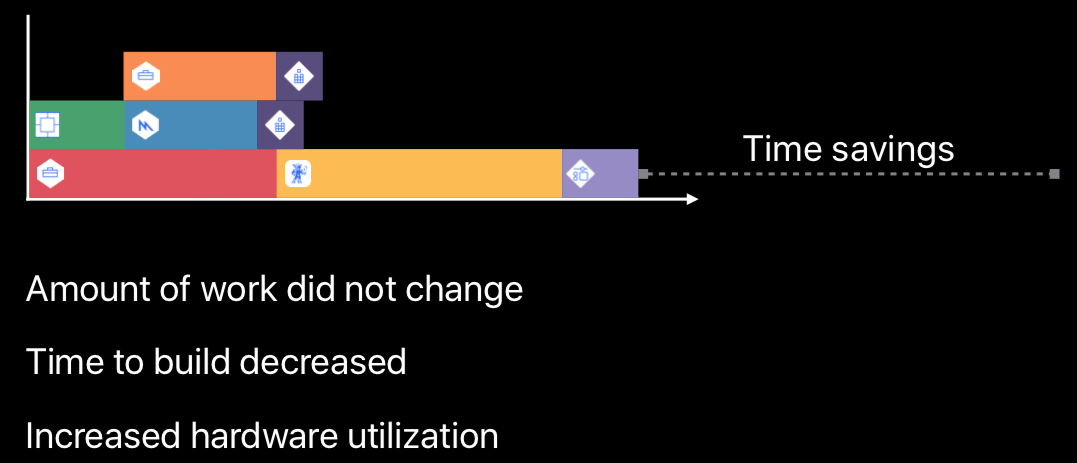 By reducing the size of your targets, you will obtain a better parallelization.
When opening your project in Xcode 10, build parallelization should already be enabled. To check or change this option, open your scheme editor, select “Build” in the sidebar and make sure “Parallelize Build” is checked at the top.
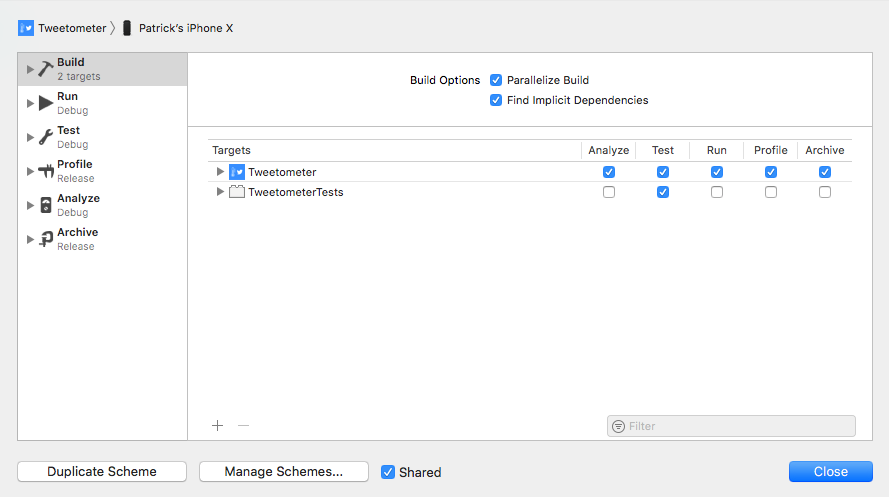 Xcode Scheme editor build options.
Of course, Xcode can’t build all your targets at once. Your project will most likely have some dependencies between the targets. A cool algorithm that is usually used to solve dependencies and figure out the order of compilation is topological sorting.
Fun fact: this is a common topic in technical interviews at Big N companies, so definitely learn more about it if you’re interested in computer science problems.
There’s one thing that you can do to help Xcode in parallelizing the work: split up your targets into smaller units. One example is creating a separate testing target for each framework, instead of testing all the libraries in a single unit testing bundle.
You can view the dependencies of a target directly in the “Build Phases” section. Let’s take one of my side projects that I have been working on lately, Tweetometer. TweetometerKit is a framework that contains the business logic of the app, such as network requests and models. The main app target Tweetometer specifies TweetometerKit as an explicit target dependency, in order to tell Xcode that it requires the framework to be ready before it can compile itself. In the “Link Binary with Libraries”, implicit target dependencies are specified which are also used to figure out the dependency order.
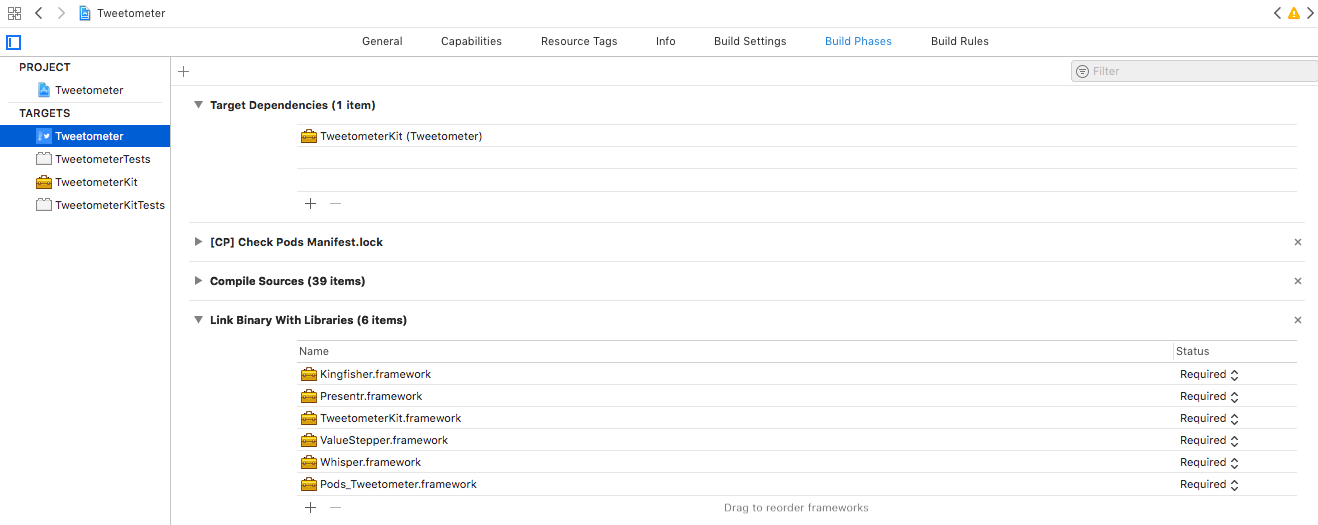 An example of build phases that specify dependencies between modules.
If your Xcode project is a few years old and survived some refactorings, make sure you are not specifying unnecessary target dependencies that may slow down your build.
One last improvement in the Xcode 10 build process worth mentioning is the parallelization of some parts of the build process. Xcode starts the compilation of a target as soon as the build and the run script phases of its dependencies are complete. This means that the next target to be built will start a little bit early compared to Xcode 9, since linking and other operations can now be done in parallel.
Declaring script inputs and outputs
A run script phase allows you to execute custom code during the compilation of the target. You may have created a run script to invoke Carthage’s copy-frameworks script. I also use this feature in Tweetometer in combination with swiftgen to generate boilerplate code to safely access Storyboards views, Localizable strings and resources stored in the Asset Catalog. A run script is always run if a list of input files is not specified, the list of inputs changes or the output files are missing.
The following run script is only executed in case carthage update is run and the frameworks are re-built, otherwise it’s skipped saving precious time in your builds.
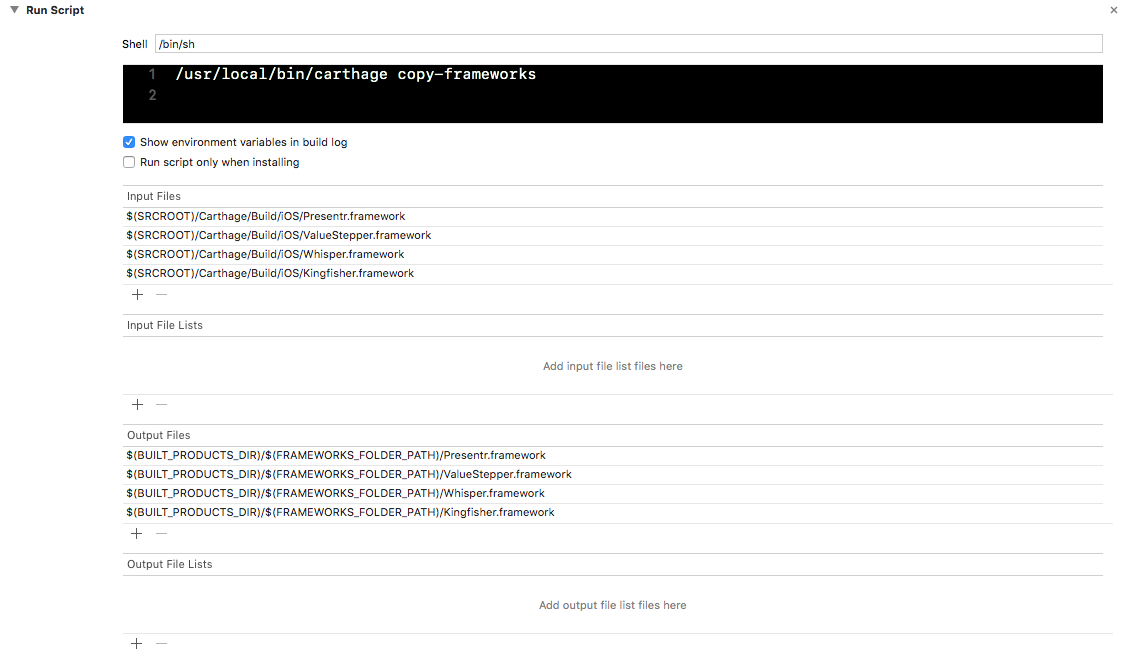 A common run script required when using Carthage.
The following run script invokes swiftgen every time the projects builds since no input or output files are specified.
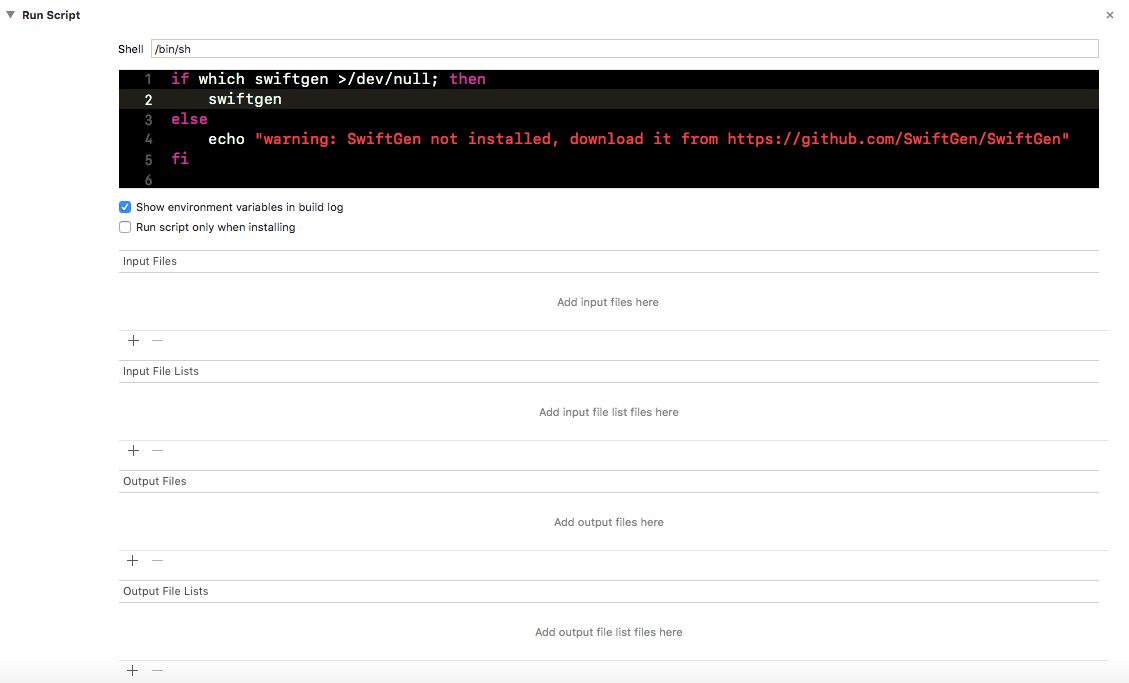 A custom run script that invokes an external tool to generate source code.
As you may have noticed from these screenshots, Xcode 10 has a new option to specify an input and output file lists. In case you have many files to list, you can do so by simply creating a .xcfilelist file and specify all the directories in it. You could for example set up a script to automatically update a Carthage.xcfilelist every time you add a new dependency in order to avoid forgetting to add a new input and output file. The format of the file is pretty straightforward:
$(SRCROOT)/Carthage/Build/iOS/Presentr.framework
$(SRCROOT)/Carthage/Build/iOS/ValueStepper.framework
$(SRCROOT)/Carthage/Build/iOS/Whisper.framework
$(SRCROOT)/Carthage/Build/iOS/Kingfisher.framework
Xcode 10 got much better in diagnosing dependency cycles in your project by giving detailed errors in the build log. A new guide has also been published online to learn how to troubleshoot and fix a cycle.
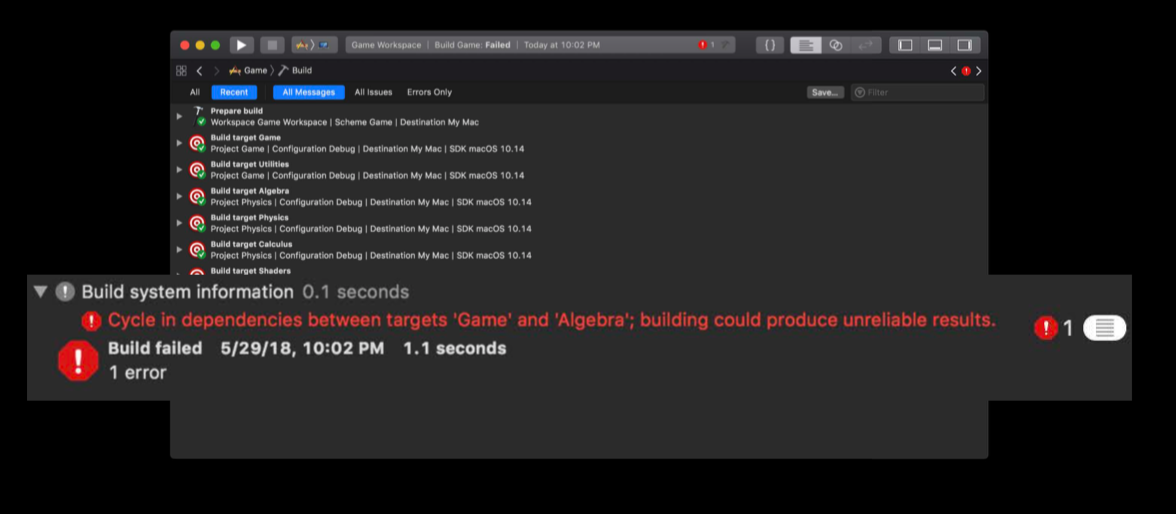 A new error message is displayed if your build presents cycles.
Apple also released more documentation about these features and a lot of other details related to the Xcode build process (such as a build settings reference page for example).
Measuring your build time
Xcode 10 brings some new features to identify how long each component of your project is taking to compile. In previous versions, there was no official way to know how long each file took to compile, except some third-party tools or undocumented compiler flags. Xcode now shows directly in the build log how long each file took to compile as shown in the following image.
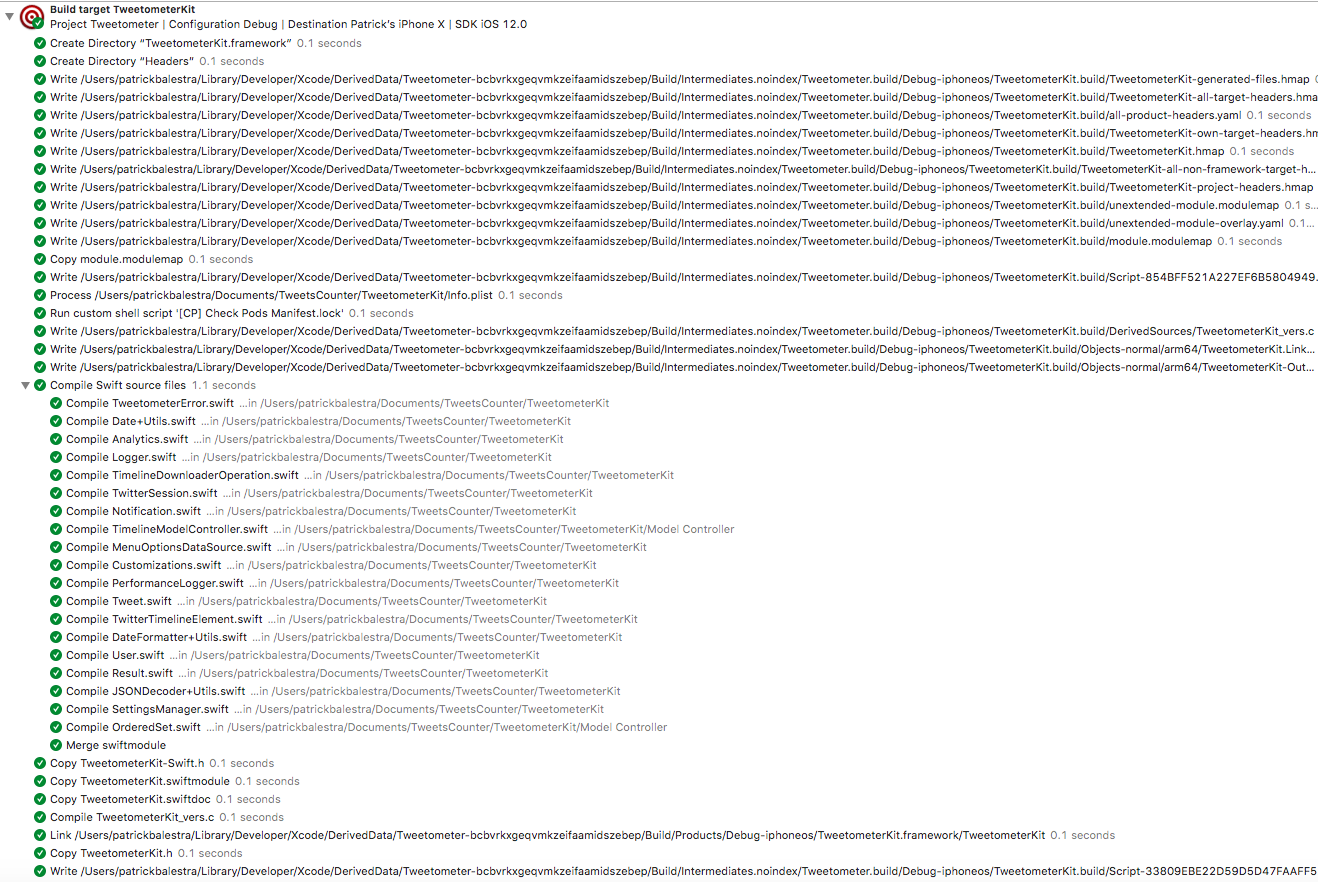 The build now displays the compilation time for each file.
There’s also a new feature that allows you to debug and see how long each step of the build process is taking. This enables to quickly see if a run script phase is configured properly to run only when necessary. Select Product -> Perform Action -> Build With Timing Summary to build and see the timing summary at the end of the build log. You can also set the -showBuildTimingSummary parameter if you’re using xcodebuild.
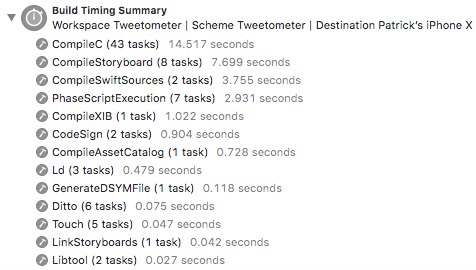 The Build Timing Summary is a quick way to see the overall time distribution.
Dealing with complex Swift expressions
You may remember from your researches on how to improve the Swift compilation time about the “Compilation Mode” build setting. In some projects, setting the “Compilation Mode” to “Whole Module” resulted in faster build times with previous versions of the compiler. The Swift compiler has been now updated to be more efficient in incremental builds so this workaround is not applicable anymore. It may slow down your builds since it turns off incremental builds. Make sure to select the setting in your Xcode project and press “delete” to set it back to the default value “Incremental”.
 The debug and release Compilation Mode build setting.
Another source of slowdown in the compilation of your Swift source code is the evaluation of complex expressions. The following is an extreme example of what you should avoid doing in your code. If you really have to write code like this, try to break it up into multiple expressions and specify the return types or local variables types manually. Including complex expressions in the ternary operator, or using very generic operators such as += instead of append on Array are other examples of possible slow-downs to be aware of.
func sumNonOptional(i: Int?, j: Int?, k: Int?) -> Int? {
    return [i, j, k].reduce(0) { soFar, next in
        soFar != nil && next != nil ? soFar! + next! : (soFar != nil ? soFar! : (next != nil ? next! : nil))
    }
}
Understanding dependencies in Swift
Swift doesn’t have header files like Objective-C, therefore it’s important to understand how the Swift compiler recognizes which files to recompile when a change is made. Swift supports multiple objects in the same source code file so you could define all your project’s entities in a single file if you really wanted (please don’t). The compiler tracks files and not single entities such as different struct, enum or class. If you happen to have a single file with 10 different entities defined in it such as a protocol, enum, struct and class, adding or removing entities in the same file or simply changing source code outside the function bodies will trigger a re-compilation of the whole file. Let’s see an example to better understand this concept.
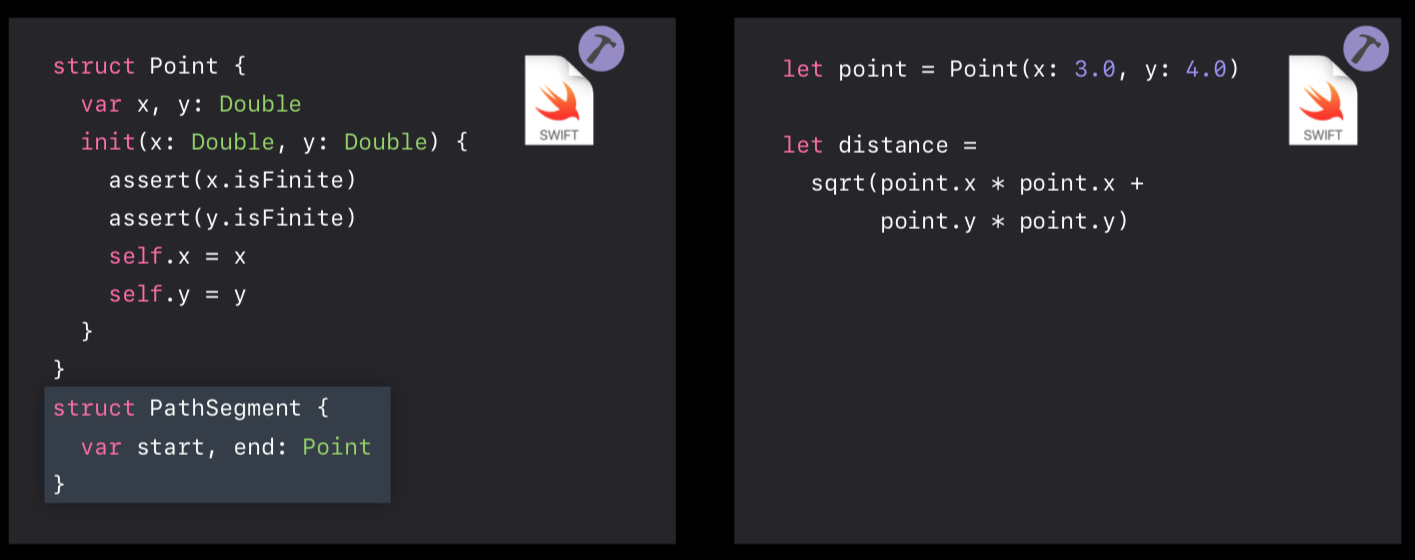 A very simple example that shows why Swift re-compiles both files.
The file on the left defines a Point struct. The file on the right instead, simply defines two top-level properties which invoke the Point initializer. Adding the new PathSegment struct to the same file where Point is defined, will cause the Swift compiler to conservatively rebuild both files. This wouldn’t happen if the point constant on the right file was defined inside a function, but it’s still something to keep in mind. The Swift compiler is only able to avoid recompiling other files if your changes are confined to the function bodies. Changes to a method implementation obviously don’t affect the file’s interface but in all other cases, the compiler will trigger a recompilation of all the files that depend on it. To reduce this behavior, you should try to split up your entities in separate files. Creating a new file for each entity will not only make your incremental builds shorter but also make it even easier to find what you’re looking for in your project.
Limiting your Objective-C/Swift interface
Let’s now see how the previous concept of code dependency plays in a mixed-source target written in both Swift and Objective-C.
There are two types of headers:
- Bridging Header: collects the Objective-C interfaces that should be exposed to Swift.
- Generated Header: collects the Swift interfaces that should be exposed to Objective-C.
These files are used in order to figure out the dependencies between Swift and Objective-C. If the following Swift class is changed, it will require a recompilation of all Objective-C files that reference it for example.
class EmptyStateViewController: UIViewController {
    @IBOutlet var messageLabel: UILabel!
}
It is a good idea to define properties or functions which are exposed to Objective-C by default as private. This also benefits the encapsulation of your code since no other object in the same module will be able to modify the messageLabel by mistake.
One last build setting to check in your target is the “Swift 3 @objc Inference”. You may not even know about this build setting at all because it was created automatically during the Swift 4 migration performed by Xcode. This behavior caused every property in an NSObject subclass to be exposed to Objective-C in the Generated Header. You should now set the build setting to the default value by pressing “delete” on it. If your project fails to compile since Objective-C can’t find a method defined in Swift, simply add @objc to the function declaration in order to comply with the new Swift 4 behavior.

I hope this post was useful and will save some time to your Mac’s CPU with the upcoming Xcode 10 update.
Feel free to tweet me with any questions or comment. 👍
P.s: all Swift snippets in this post have been generated with Splash, a new Swift syntax highlighter just open-sourced by my friend John Sundell. Check it out!